 By Meghna Sharma
Watch any Indian stock chart long enough, and you’ll notice a pattern that shows up again and again — Nifty stalls near 25,000, bounces off the same level three times in a month, then finally breaks through and rallies, or a stock keeps finding buyers exactly around the same price every time it dips. This isn’t coincidence or chart-reading superstition; it’s support and resistance at work, arguably the single most foundational concept in technical analysis and one that every Indian trader, from someone tracking a single stock casually to an active F&O trader, ends up relying on in some form. Understanding what these levels actually are, why they form, and how to use them practically is often the difference between trading with a genuine framework and simply guessing based on gut feeling.
This guide breaks down support and resistance clearly, with practical context for how Indian traders actually apply the concept.
What Support and Resistance Actually Mean
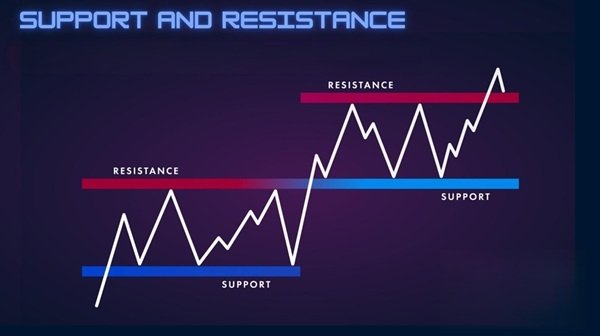
At its core, this concept describes price levels where a stock or index has historically struggled to move past, based purely on the balance of buying and selling pressure at that point.
- Support is a price level where a falling stock or index tends to stop declining and bounce back up, because buying interest at that price is strong enough to absorb the selling pressure.
- Resistance is the opposite — a price level where a rising stock tends to stop climbing and reverse downward, because selling pressure at that price overwhelms the buying interest pushing it higher.
- These levels aren’t fixed rules or guarantees — they’re observations of where buyers and sellers have previously shown strong conviction, and traders use that history as a reasonable, though imperfect, guide to future price behavior.
- Once a resistance level is broken decisively, it often flips and becomes a new support level, and the reverse holds true too — a broken support level frequently becomes resistance on the next rally. This “role reversal” is one of the more consistently observed patterns in technical analysis.
Why Support and Resistance Levels Actually Form
Understanding the underlying logic — not just memorizing the definition — makes the concept far more useful in practice.
- Psychological price levels matter enormously — round numbers like Nifty 25,000 or a stock at ₹1,000 often act as support or resistance simply because traders collectively anchor their decisions around these memorable figures.
- Prior significant price action — a level where a stock previously reversed sharply, gapped up or down, or saw an unusually large volume spike — tends to be remembered by the market and often triggers similar reactions when price revisits it.
- Large institutional orders frequently sit at specific price levels, since big funds and institutions often place substantial buy or sell orders at round numbers or technically significant points, and these orders themselves can create genuine support or resistance simply through their size.
- Collective trader memory and behavior plays a real role too — if a large number of traders bought a stock at a certain level and it later falls back to that price, many of those traders may sell simply to “get out even,” creating resistance at their original entry price.
How to Identify Support and Resistance on a Chart
Spotting these levels is a skill that improves with practice, but a few consistent approaches make the process more systematic.
- Look for multiple touches at a similar price level, since a price point that a stock has bounced off or reversed from two or three separate times carries more significance than a level touched just once.
- Pay attention to high-volume price areas, since levels where a large number of shares changed hands tend to represent stronger, more meaningful support or resistance than areas with thin trading activity.
- Use round numbers and psychologically significant levels as a starting reference, particularly for indices and heavily-traded large-cap stocks, since these often act as natural markers even before any specific chart pattern confirms them.
- Draw horizontal lines connecting swing highs (for resistance) and swing lows (for support) on the chart, a simple but genuinely effective visual method that most charting platforms, including those built into Indian broker apps, make easy to do directly on the price chart.
- Consider using moving averages as dynamic support and resistance, since a stock’s 50-day or 200-day moving average often acts as a level where price finds support during an uptrend or resistance during a downtrend, moving gradually over time rather than staying fixed.
The Difference Between Static and Dynamic Levels
Support and resistance isn’t always a flat, unchanging line, and understanding this distinction helps you read charts more accurately.
- Static support and resistance refers to fixed horizontal price levels that don’t change over time — a specific price a stock has repeatedly bounced off or rejected from.
- Dynamic support and resistance moves along with price, most commonly represented by trendlines connecting a series of rising lows (in an uptrend) or falling highs (in a downtrend), or by moving averages that shift gradually as new price data comes in.
- Trendlines specifically act as dynamic support in an uptrend and dynamic resistance in a downtrend, giving traders a sloped reference line rather than a flat one, which better reflects a stock’s actual directional momentum.
- Recognizing which type of level you’re dealing with matters because dynamic levels require regular updating as new price data arrives, unlike static levels which, once identified, generally hold their relevance until clearly broken.
How Traders Actually Use Support and Resistance
Beyond simply identifying these levels, the real value lies in how they inform actual trading decisions.
- Entry points: many traders look to buy near a confirmed support level, on the expectation that buying pressure will likely reassert itself there, and similarly look to sell or short near resistance, anticipating a reversal.
- Stop-loss placement: support and resistance levels are commonly used to set stop-losses — placing a stop just below a support level when buying, or just above resistance when shorting, since a genuine break of the level suggests the original trade thesis has failed.
- Profit targets: resistance levels often serve as reasonable places to book profits on a long position, since price frequently struggles to move past them on the first attempt, while support levels serve the same purpose for short positions.
- Breakout trading: some traders specifically wait for a decisive break above resistance or below support, on the theory that a genuine breakout — especially on strong volume — signals the start of a new, sustained price move rather than another failed attempt.
- Range trading: when a stock is moving sideways between a clear support and resistance level, traders sometimes buy near support and sell near resistance repeatedly, treating the range itself as a tradeable structure until it eventually breaks.
Common Mistakes When Using Support and Resistance
A number of recurring errors trip up traders, particularly beginners, when applying this concept in practice.
- Treating support and resistance as exact, precise prices rather than zones — markets rarely reverse at the exact same rupee figure every time, so it’s more useful to think of these as approximate areas rather than laser-precise lines.
- Ignoring volume when evaluating a breakout, since a break above resistance on weak, low volume is far less reliable than one accompanied by a genuine surge in trading activity, and treating both signals identically leads to frequent false breakout losses.
- Drawing too many levels on a single chart, cluttering the picture with lines of questionable significance until almost every price becomes “support” or “resistance” somewhere, which defeats the purpose of using the concept to make clearer decisions.
- Failing to update trendlines and dynamic levels as new price data comes in, continuing to rely on an outdated trendline that no longer reflects the stock’s current behavior.
- Assuming a level will always hold simply because it held previously, without accounting for changed fundamentals, market sentiment, or broader index movement that can invalidate a previously reliable level.
Combining Support and Resistance With Other Tools
While genuinely useful on its own, support and resistance analysis tends to work best as one part of a broader decision-making process rather than the sole basis for a trade.
- Combining it with volume analysis gives a clearer sense of whether a level is likely to hold or break, since strong volume at a support bounce or resistance breakout adds meaningful confirmation.
- Using it alongside momentum indicators like RSI or MACD helps confirm whether a stock approaching a key level is genuinely overbought or oversold, adding another layer of context beyond the price level alone.
- Checking broader market and sector context — how Nifty or the relevant sectoral index is behaving — helps assess whether an individual stock’s support or resistance is likely to hold given the overall market environment, since even a strong individual level can break down during a sharp broad-market move.
- Considering upcoming events — quarterly earnings, RBI policy announcements, major economic data — that could override technical levels entirely through sudden, news-driven volatility, regardless of how well-established the chart pattern looks.
Frequently Asked Questions
Q1. How do I know if a support or resistance level is “strong” enough to actually trust for a trade?
A. Look for a combination of factors rather than relying on any single signal. A level tested multiple times, accompanied by high trading volume on those tests, aligned with a round number or a major moving average, and holding up across different timeframes (daily and weekly charts both showing the same level) can add confidence. A level touched only once on low volume deserves much more caution.
Q2. What should I do if a stock breaks through support or resistance but then quickly reverses back, creating a “false breakout”?
A. This is a common and frustrating pattern, and one way to reduce the risk is to wait for confirmation—a candle closing clearly beyond the level, ideally accompanied by strong volume—rather than reacting to the first tick that crosses the line. False breakouts can occur on weak volume and reverse quickly after crossing the level.
Q3. Does support and resistance work the same way for intraday trading as it does for longer-term investing?
A. The underlying principle is identical, but the timeframe changes what counts as significant. Intraday traders typically look at levels formed within current or recent trading sessions using shorter timeframe charts, such as 5-minute or 15-minute charts. Long-term investors focus more on levels visible on weekly or monthly charts formed over months or years. The timeframe of the analysis should therefore match the timeframe of the trade or investment.
Q4. Can support and resistance levels be used reliably on volatile stocks, or do they only work for stable, large-cap companies?
A. The concept applies to any stock, but reliability can decrease with higher volatility and lower liquidity. Small-cap and thinly traded stocks may move through apparent support or resistance levels more erratically because of lower trading volume and sharp reactions to news. Such levels are generally better treated as zones rather than exact prices and combined with appropriate risk management.
 Nishant Pal